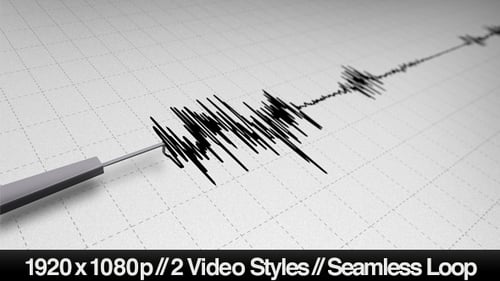
Animated Line Graph: Dynamic Data Visualization in Two Styles
By butlermOne great value subscription from $16.50/month
- Unlimited downloads of 27+ million creative assets
- AI Tools: video, image and more
- Lifetime commercial license
- Easy cancellation
- Length
- 0:36
- Resolution
- 1920 x 1080
- File Size
- 695 MB
- Frame Rate
- 29.97 fps
- Alpha Channel
- No
- Looped
- No
- Video Encoding
- Photo JPEG
- Orientation
- Horizontal
- Commercial License
- Further Information
Description
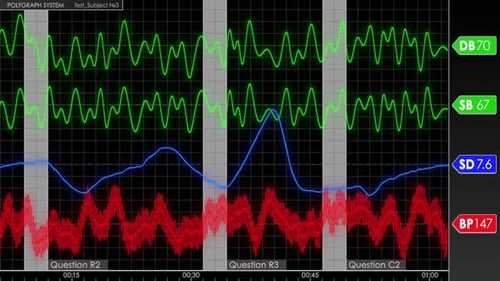
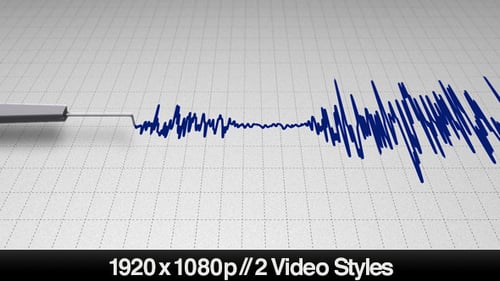
This animated clip presents a dynamic line graph visualization, reminiscent of seismograph or electrocardiogram (ECG) readouts. A stylus draws a fluctuating blue line across a digital canvas, responding to unseen data. The animation showcases two distinct visual styles: one features the line drawing over a subtle grid background with slight depth, while the second style presents a cleaner, flatter line against a plain light background. This versatile visual effect is ideal for illustrating scientific data, medical readouts, research findings, or any concept requiring a clear, evolving graphical representation. It can enhance presentations, explainer videos, or documentaries by visually tracking trends, heartbeats, or statistical changes with a polished and modern aesthetic.