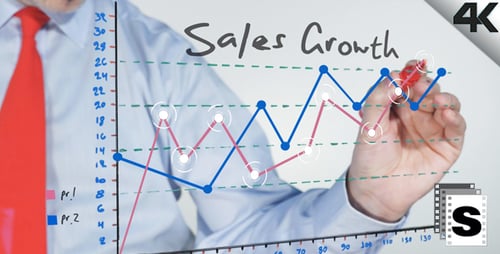
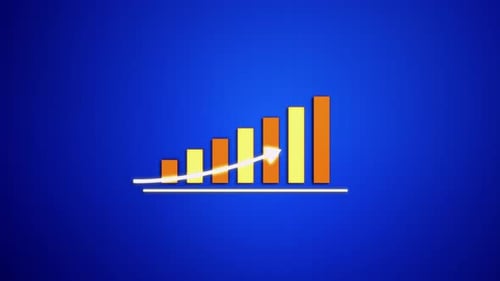
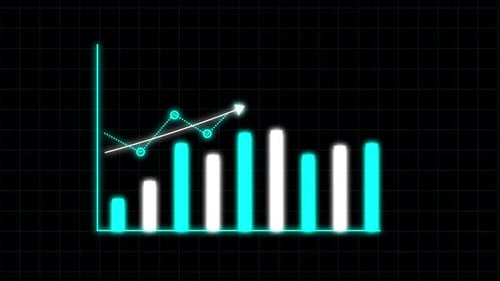
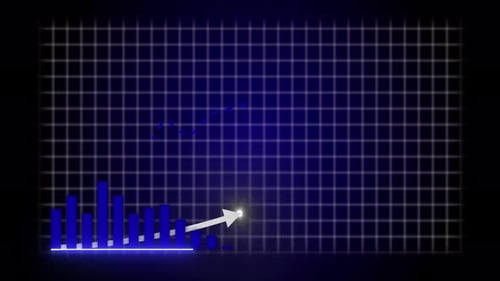
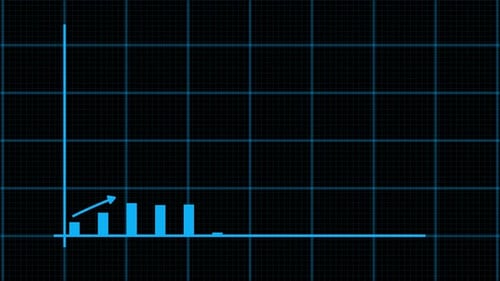
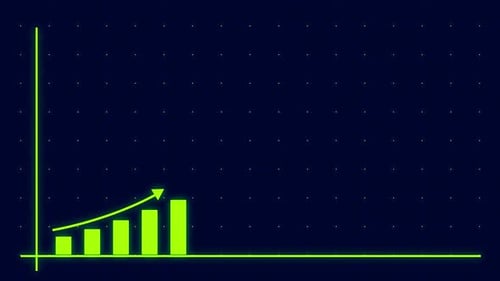
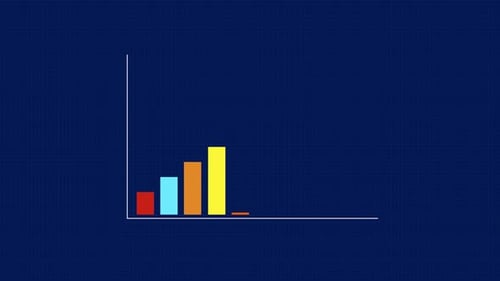
Animated Sales Growth Bar Chart and Line Graph
By Ahmet-SimsekOne great value subscription from $16.50/month
- Unlimited downloads of 27+ million creative assets
- AI Tools: video, image and more
- Lifetime commercial license
- Easy cancellation
Already have an account? Sign in
Attributes
- Length
- 0:08
- Resolution
- 3840 x 2160
- File Size
- 8.83 MB
- Frame Rate
- 30 fps
- Alpha Channel
- No
- Looped
- No
- Video Encoding
- H.264
- Orientation
- Horizontal
- Commercial License
- Further Information
Description
This animated clip showcases a dynamic bar chart illustrating sales growth over time, accompanied by an upward-trending line graph. Against a dark grid background, glowing blue bars progressively rise, emphasizing increasing metrics. The word 'SALES' appears prominently, clearly defining the data being presented. This visual effect is ideal for corporate presentations, financial reports, business explainers, and any project requiring a clear, engaging representation of positive economic or market performance. Its clean, modern aesthetic and compelling data visualization enhance the clarity and impact of statistical information.